 Technical Analysis for Beginners: Complete Trading Guide
You look at a forex chart. You see lines moving up and down. You wonder how to make sense of it. Technical analysis gives you the answers. It is the study of price movement using charts and indicators. Learning technical analysis for forex trading helps you predict where price might go next. This guide covers the basics. You will learn the core concepts that every trader uses.
What Is Technical Analysis
Technical analysis is the study of past price data to forecast future movement. It assumes price reflects everything known about a market. News, economic data, and trader sentiment all show up in the price.
Technical analysis for forex trading focuses on charts. You look at patterns, trends, and levels. You use indicators to confirm what you see.
The goal is simple. Find high-probability setups where price is likely to move your way.
Why Technical Analysis Works in Forex
Forex markets move in patterns. Traders remember past price levels. They place orders at these levels. This creates self-fulfilling behavior.
Support and resistance levels work because traders watch them. Breakouts happen because traders enter at the same prices.
Learning technical analysis for forex trading helps you see these zones. You trade with the crowd instead of against them.
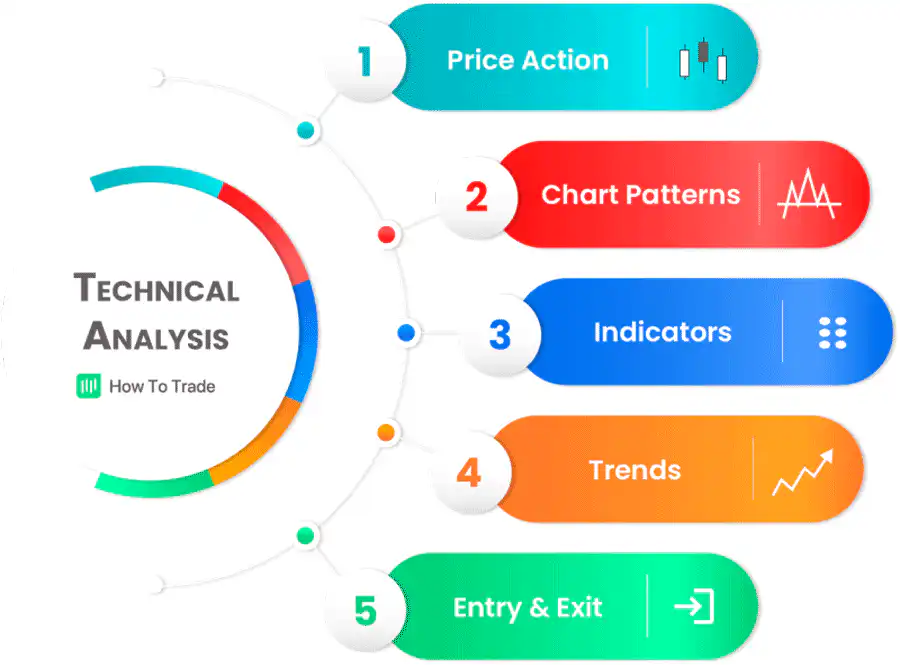
Core Concepts Every Beginner Needs
Trend
Trend is your friend. Price moves in one direction for extended periods. Uptrend has higher highs and higher lows. Downtrend has lower highs and lower lows. Sideways means ranging.
Trade in the trend direction. Your odds improve significantly.
Support and Resistance
Support is a price level where buying enters and stops the fall. Resistance is a level where selling enters and stops the rise.
Mark these levels on your charts. Watch how price reacts when it approaches them.
Candlestick Patterns
Each candlestick tells a story. The body shows open to close. The wicks show highs and lows.
Learn a few basic patterns. Hammer at support suggests reversal. Engulfing candles show strong momentum. Doji means indecision.
Essential Indicators for Beginners
Start with these three. They cover most situations.
Moving Averages
Moving averages smooth out price noise. The 20-period and 50-period are common. When price is above the average, trend is up. When price crosses the average, momentum shifts.
Relative Strength Index (RSI)
RSI measures momentum. It runs from 0 to 100. Above 70 means overbought. Below 30 means oversold. Use it to spot potential reversals.
Moving Average Convergence Divergence (MACD)
MACD shows trend strength and direction. When the MACD line crosses above the signal line, momentum turns up. Crosses below signal down moves.
How to Build a Simple Trading Strategy
Combine what you learned. Here is a basic approach using technical analysis for forex trading.
Identify the trend first. Use a 1-hour chart and a 200-period moving average. If price is above the average, look for buys only.
Wait for a pullback. Price moves against the trend briefly. Mark a support level.
Watch for reversal signals. A hammer candlestick at support works well. RSI below 30 adds confidence.
Enter when the reversal candle closes. Place your stop-loss below the support level. Set your target at the recent high.
This simple strategy uses trend, support, candlesticks, and RSI. It is a complete technical analysis for forex trading approach.
Common Mistakes Beginners Make
Adding too many indicators. Charts become cluttered. You see conflicting signals. Start with two or three tools.
Ignoring the higher timeframe. A 5-minute chart shows noise. Check the 1-hour or 4-hour chart to see the real trend.
Trading without a stop-loss. Technical analysis gives you levels. Use them. Protect your capital.
Chasing price after a big move. Wait for pullbacks. Entries are better when price comes back to support or resistance.
Practice Before Trading Real Money
Technical analysis takes practice. You need to see hundreds of charts before patterns become automatic.
Use a demo account. Tradex1.live offers one with real market data. Practice identifying trends and marking levels. Take virtual trades. Review your results.
The demo account is free. Use it until your technical analysis for forex trading feels natural. There is no rush.
How Tradex1.live Supports Your Technical Analysis
Tradex1.live provides the charts and tools you need. The platform offers multiple timeframes from 1 minute to monthly. You see the full picture.
Indicators are built in. Moving averages, RSI, MACD, and dozens more are one click away. No complicated setups required.
Drawing tools let you mark support, resistance, and trend lines directly on the chart. Your analysis stays organized.
Real-time data ensures you see price moves as they happen. No delays. No guessing.
The platform stays stable during volatile sessions. Your charts keep updating when you need them most.
Building Your Skills Over Time
Start with one concept. Master trend identification. Spend a week marking uptrends and downtrends on your charts.
Add support and resistance next. Draw levels every day. Watch how price reacts.
Then learn candlestick patterns. Practice spotting them in real time.
Finally add one indicator. Use it to confirm what you already see.
This step-by-step approach builds real skill. Technical analysis for forex trading becomes second nature.
Start Your Technical Analysis Journey Today
Technical analysis gives you an edge. It turns random price movement into recognizable patterns. You learn to see what others miss.
The tools are simple. Trend, support and resistance, candlesticks, and a few indicators. Combine them with discipline.
Practice on Tradex1.live. Use the demo account to build your skills without risk. Mark charts. Take virtual trades. Review your results.
When you feel ready, transition to live trading with small positions. Keep using what you learned.
Technical analysis for forex trading is a skill. Skills improve with practice. Start today.
Trading Disclaimer
Forex trading carries significant risk. Leverage can magnify losses. You may lose more than your deposit. This information is for educational purposes. It is not financial advice. Never trade money you cannot afford to lose. Past performance does not guarantee future results. Practice with a demo account first. Consult a qualified financial advisor.