When I first opened a trading chart, I saw a mess of red and green bars. They made no sense. Then someone explained candlesticks to me, and suddenly price movements started telling a story. Learning how to read candlestick charts is the first step toward understanding what the market is actually doing. In this guide, I’ll break it down so you can start reading price action with confidence.
What Is a Candlestick?
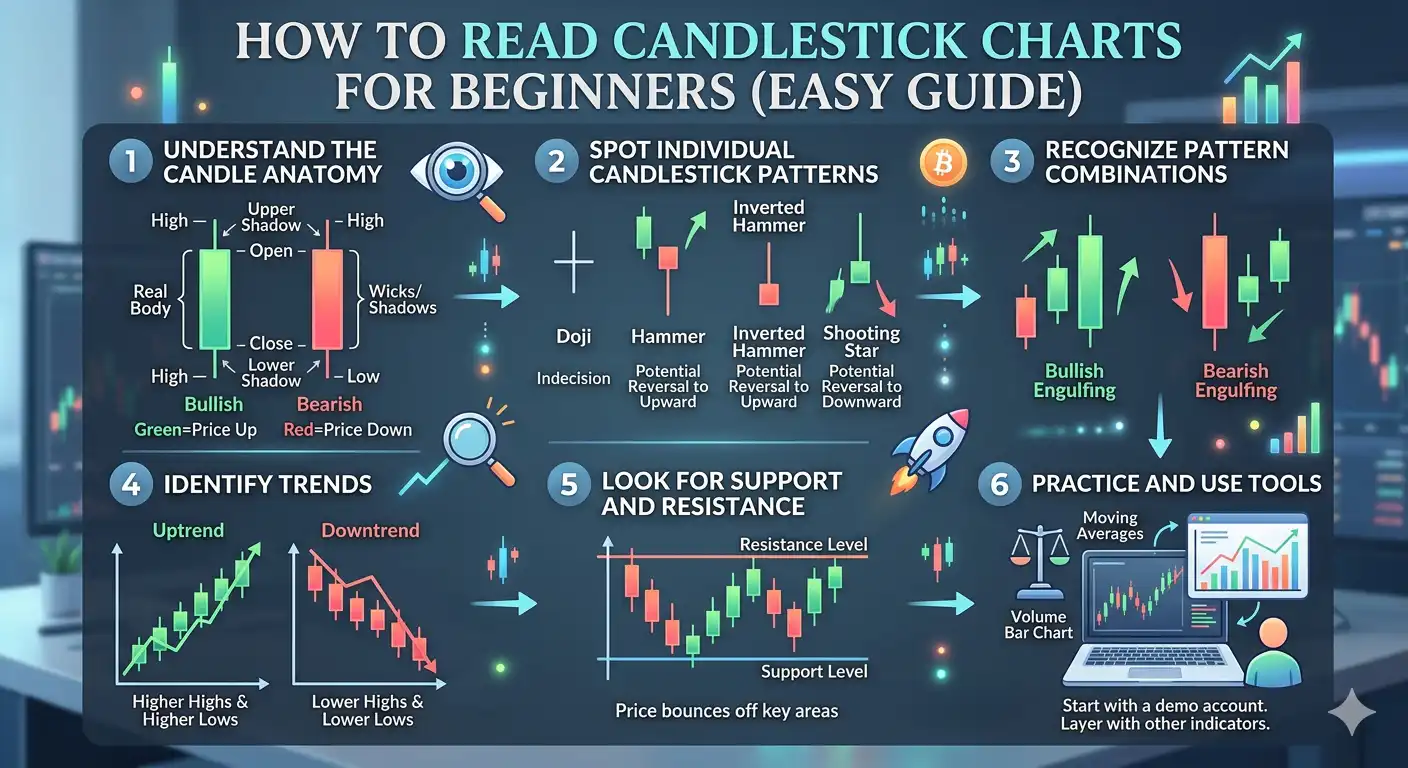
A candlestick shows four pieces of information: the opening price, the closing price, the highest price, and the lowest price for a specific period. The “body” is the thick part between open and close. The “wicks” (or shadows) are the thin lines above and below.
If the close is higher than the open, you get a green or white candle. That means buyers won that period. If the close is lower than the open, you get a red or black candle. Sellers were in control.
That’s the foundation. Once you know how to read candlestick charts, you’ll see the battle between buyers and sellers unfold candle by candle.
Bullish vs Bearish Candles
A long green body tells you buyers were aggressive. A long red body shows sellers dominated. Small bodies mean indecision. When you see a candle with a tiny body and long wicks, it’s a warning. Neither side could push far.
Take a moment to study these shapes. They appear on every timeframe, from one minute to one month. Mastering how to read candlestick charts means recognizing these simple visuals quickly.
Common Candlestick Patterns
Individual candles are useful, but patterns of two or three candles give stronger signals.
Doji – The open and close are almost the same. It signals indecision. When a doji appears after a strong trend, it often means the move is running out of steam.
Hammer – A small body at the top of the candle with a long lower wick. It forms after a drop. It tells you sellers pushed price down, but buyers stepped in and drove it back up. A potential reversal signal.
Shooting Star – The opposite of a hammer. Small body at the bottom with a long upper wick. Forms after a rally. Buyers tried to push higher but failed, and sellers took over.
Engulfing Pattern – A two-candle pattern. A bullish engulfing is a green candle that completely covers the previous red candle. It shows a sudden shift from selling to buying. A bearish engulfing is the reverse.
These patterns are the alphabet of price action. When you learn how to read candlestick charts, you start recognizing these setups naturally.
Timeframes Matter
Candlesticks work on any timeframe. Day traders use 1‑minute or 5‑minute candles. Swing traders use 4‑hour or daily candles. The pattern means the same thing, but the signal gets stronger on higher timeframes.
I recommend beginners start with the daily chart. It filters out noise and gives you time to think. Practice how to read candlestick charts on daily bars first, then move to smaller timeframes when you feel comfortable.
Putting It All Together
Here’s a simple way to use candlesticks.
First, identify the trend. Draw a moving average or a trendline. Next, look for a pullback to a key level like a support zone or a moving average. Then wait for a candlestick pattern to form at that level.
For a long trade, you want a bullish engulfing or a hammer at support. For a short trade, you want a bearish engulfing or a shooting star at resistance. Enter on the close of the signal candle or on a small retest. Place your stop below the recent swing low for longs, above the recent swing high for shorts.
This simple approach works because you’re combining trend, level, and signal. And it all starts with how to read candlestick charts.
Practice with a Demo Account
Reading candles on a live chart is different from seeing pictures in a book. You need to watch them form in real time. That’s why a demo account is invaluable.
Tradex1.live offers a full demo environment with real‑time data. You can pull up any chart, scroll through timeframes, and practice spotting patterns without risking money. Use it to test your how to read candlestick charts skills. Set alerts at key levels and watch how candles react.
Your Next Step
Candlesticks are your window into market psychology. Every candle tells a story of fear, greed, hesitation, and conviction. Once you learn how to read candlestick charts, you’ll never look at price the same way.
Start with the daily chart. Focus on one pattern at a time. Practice on a demo. Be patient. The skill builds over weeks, not days.
Risk Disclaimer: Trading financial instruments on margin carries a high level of risk. It may not be suitable for all investors. You could lose some or all of your invested capital. Ensure you understand the risks and seek independent advice if needed.