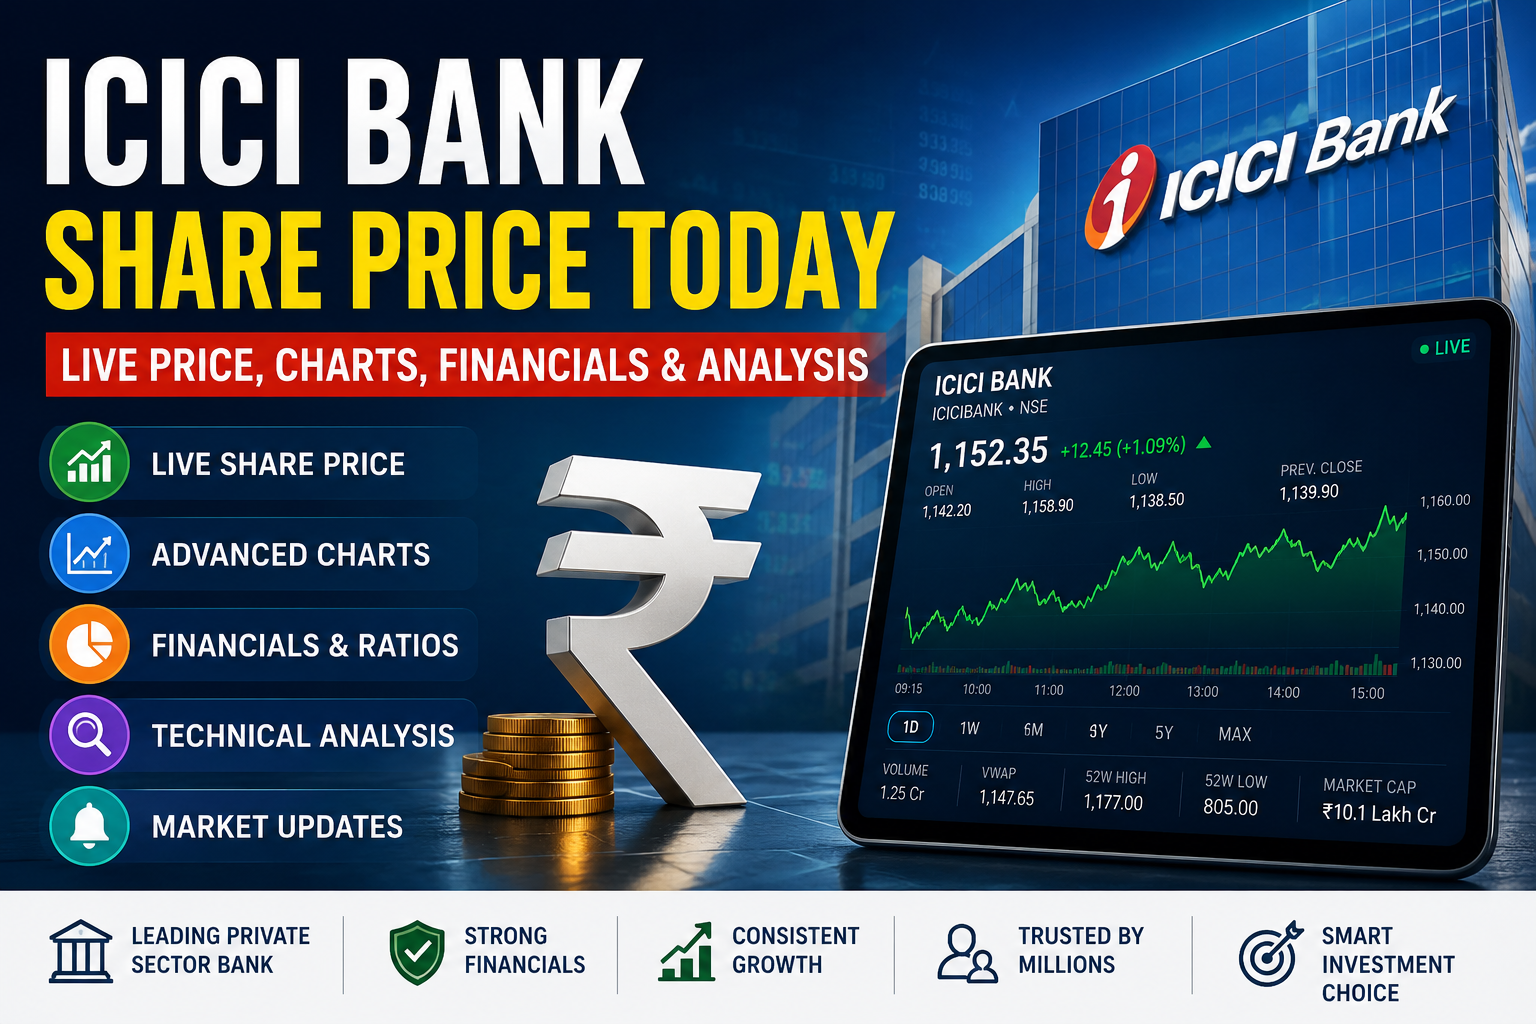
ICICI Bank Share is the stock of ICICI Bank Ltd., one of India’s largest private sector banks & a leading company in the Indian stock market. Moreover, it is widely followed by most of the traders and investors due to its strong financial performance, high trading volume & inclusion in major stock market indices such as the Nifty 50 and Sensex. In this blog, we will cover everything you need to know about ICICI Bank Share & how Tradex1.live helps you track the stock with real-time market data and insights.
ICICI Bank Share Overview
| Particular | Details |
| Company Name | ICICI Bank Limited |
| NSE Symbol | ICICIBANK |
| BSE Code | 532174 |
| Sector | Financial Services |
| Industry | Private Sector Banking |
| Market Cap | Large Cap (Check live market cap on Tradex1.live) |
| Founded | 1994 |
| Headquarters | Mumbai, Maharashtra, India |
| CEO | Sandeep Bakhshi |
| Nifty 50 | Yes |
| Sensex | Yes |
ICICI Bank Share Price Live
The ICICI Bank Share Price Live provides real-time updates on the stock’s price during market hours. By tracking live price data, traders & investors can easily understand market movements & make informed decisions. On Tradex1.live, you can simply monitor all the important share price details in one place which includes:
Trader Reviews





- Live Price: The current market price of ICICI Bank shares.
- Day High: The highest price the share has reached during the trading day.
- Day Low: The lowest price at which the share has traded during the day.
- Open Price: It is the price at which the share started trading when the market opened.
- Previous Close: The closing price of the share from the previous trading session.
- Volume: The total number of ICICI Bank shares traded during the day.
- VWAP (Volume Weighted Average Price): The average price of the share based on both price and trading volume, which help traders understand the stock’s average trading value.
- Market Depth: This displays the number of buy and sell orders available in the market, giving an idea of supply and demand.
- 52-Week High: The highest price the share has reached in the last 52 weeks.
- 52-Week Low: The lowest price the share has traded at in the last 52 weeks.
With Tradex1.live, you can track the ICICI Bank Share Live Price, interactive charts, market depth, technical indicators, and other real-time market data to stay updated and make better trading and investment decisions.
ICICI Bank Share Price Chart
| Chart Type | Description |
| Intraday Chart | This shows the share price movement during the current trading day. |
| 1 Day Chart | It displays the complete price movement of one trading day. |
| 1 Week Chart | Shows how the share price has performed over the last 7 days. |
| 1 Month Chart | Helps you to analyze the stock’s performance over the past month. |
| 6 Months Chart | This displays the price trend over the last six months. |
| 1 Year Chart | Shows the share’s performance over the past year to identify long-term trends. |
| 5 Years Chart | It displays the stock’s performance over the last five years. |
| Max Chart | Shows the complete historical price performance of ICICI Bank Share since its listing. |
About ICICI Bank
ICICI Bank Ltd. is one of India’s largest private sector banks, established in 1994. It provides a wide range of banking and financial services to individuals, businesses & corporate customers. The bank is listed on both the NSE and BSE and is even a part of the Nifty 50 and Sensex.
ICICI Bank provides retail banking services such as savings accounts, loans, credit cards, fixed deposits & digital banking. Moreover, it provides corporate banking solutions, which includes business loans, trade finance, and cash management services. The bank has a strong digital banking platform that allows customers in order to access banking services through mobile and internet banking.
In addition to its operations in India, ICICI Bank has an international presence and several subsidiaries, including ICICI Prudential Life Insurance, ICICI Lombard General Insurance, ICICI Securities, and ICICI Prudential AMC. Today, the bank serves millions of customers, which makes it one of the leading and most trusted banks in India.
ICICI Bank Financial Performance
| Financial Metric | What It Means | Why It Matters |
| Revenue | It is total income earned by the bank from its operations. | Higher revenue indicates business growth. |
| Net Profit | The profit left after deducting all expenses and taxes. | Shows the bank’s overall profitability. |
| EPS (Earnings Per Share) | It is the profit earned for each outstanding share. | Higher EPS is generally positive for shareholders. |
| ROE (Return on Equity) | Measures how efficiently the bank uses shareholders’ money to generate profit. | A higher ROE indicates better financial performance. |
| ROA (Return on Assets) | Shows how efficiently the bank uses its assets to earn profit. | Higher ROA reflects better asset utilization. |
| Net Interest Margin (NIM) | The difference between interest earned and interest paid as a percentage of earning assets. | A higher NIM indicates better profitability from lending activities. |
| CASA Ratio | Percentage of current and savings account deposits compared to total deposits. | A higher CASA ratio helps reduce the bank’s funding costs. |
| Gross NPA | Total value of loans that have become non-performing before provisions. | A lower Gross NPA indicates better loan quality. |
| Net NPA | Non-performing loans remaining after deducting provisions. | Lower Net NPA reflects stronger financial health. |
| Capital Adequacy Ratio (CAR) | Measures the bank’s ability to absorb financial losses. | A higher CAR indicates a financially stable and well-capitalized bank. |
Note: You can simply track ICICI Bank’s latest financial performance, key ratios, and market updates on Tradex1.live in order to make more informed investment decisions.
ICICI Bank Share Fundamental Analysis
Fundamental analysis helps investors evaluate the financial strength & long-term growth potential of ICICI Bank Share. Before you invest, it is important to understand the following key metrics:
- Market Capitalization: It shows the total market value of ICICI Bank. A higher market cap generally indicates a large and well-established company.
- PE Ratio (Price-to-Earnings Ratio): This compares the share price with the company’s earnings per share. It helps investors understand whether the stock is fairly valued.
- PB Ratio (Price-to-Book Ratio): Compares the share price with the company’s book value. It is commonly used to evaluate banking stocks.
- Book Value: Represents the company’s net worth on a per-share basis after deducting liabilities from assets.
- Dividend Yield: Shows the annual dividend paid by the company as a percentage of its current share price. Moreover, it helps investors estimate dividend returns.
- Earnings Growth: Measures how much the company’s profits have increased over time. Consistent growth indicates improving business performance.
- Sales Growth: Shows the increase in the company’s revenue over a period. Higher sales growth reflects business expansion.
- Promoter Holding: Represents the percentage of shares held by the company’s promoters. Stable promoter holding also reflects long-term confidence in the business.
- FII Holding: It shows the percentage of shares owned by Foreign Institutional Investors (FIIs). Higher FII participation may indicate strong global investor interest.
- DII Holding: Represents the percentage of shares held by Domestic Institutional Investors (DIIs), such as mutual funds and insurance companies. Higher DII holding reflects confidence from domestic institutions.
On Tradex1.live, you can easily track these fundamental indicators along with live share prices, financial data & market insights in order to analyze ICICI Bank Share more effectively.
ICICI Bank Share Technical Analysis
Technical analysis helps traders understand the price movement of ICICI Bank Share & easily identify possible trading opportunities. Some of the key indicators include:
|
Tradex1.live provides live technical charts, support and resistance levels, RSI, MACD, moving averages, volume analysis & other technical indicators in order to help you analyze ICICI Bank Share more effectively.
Factors Affecting ICICI Bank Share Price
- RBI decisions can impact the banking sector and share price.
- Changes in interest rates can affect the bank’s earnings.
- Strong or weak quarterly results influence the stock price.
- High inflation can impact banking operations and profits.
- Economic growth can support better business performance.
- The overall banking sector affects ICICI Bank’s share price.
- Buying and selling by FIIs and DIIs can move the stock.
- Global market trends can influence investor sentiment.
- Lower NPAs usually reflect better financial health.
- Higher credit growth can improve the bank’s future earnings.
ICICI Bank Share vs HDFC Bank Share
ICICI Bank and HDFC Bank are two of India’s leading private sector banks. Both have strong financial performance & are popular choices among investors. You can compare their key financial metrics which help you understand how the two banks perform.
| Feature | ICICI Bank | HDFC Bank |
| Market Cap | ~₹10.1 Lakh Crore | ~₹12.6 Lakh Crore |
| ROE | Update Live | Update Live |
| PE Ratio | ~17–19 | ~16–17 |
| Dividend | ₹12 per Share | ₹13 per Share |
| Growth | Strong Profit Growth | Strong Profit Growth |
| Net NPA | ~0.33% | Update Live |
| Loan Growth | ~12–14% YoY | ~15% YoY |
Disclaimer: This comparison is for informational purposes only and should not be considered investment advice.
Is ICICI Bank Share Good for Long-Term Investment?
Pros
| Risks
|
Why Track ICICI Bank Share Live?
Tracking the ICICI Bank Share Price helps traders and investors stay updated with the latest market movements. A reliable market platform should provide the following features:
- Live Share Price: Get real-time updates on the latest ICICI Bank share price.
- Interactive Charts: View price movements across different timeframes.
- Technical Indicators: Analyze the stock using RSI, MACD, Moving Averages, Bollinger Bands, and other indicators.
- Market Depth: Check bid and ask prices along with trading volume.
- Banking Sector Coverage: Compare ICICI Bank with other major banking stocks such as HDFC Bank, SBI, Axis Bank, Kotak Mahindra Bank, and Bank Nifty.
- Market Updates: Stay informed with the latest market news and stock updates.
- Easy-to-Use Dashboard: Track multiple stocks and market data from a single, user-friendly dashboard.
By using accurate & up-to-date market data can help you better understand stock price movements and make more informed investment decisions.
Conclusion
In the above blog, we have walked through everything you need to know about ICICI Bank Share, including its live price, company overview, financial performance, technical analysis, historical returns, dividend history, shareholding pattern, and the key factors that influence its stock price. Whether you are a trader following short-term market movements or an investor looking at long-term opportunities, understanding these factors can help you make more informed decisions. Remember that stock prices can change due to market conditions, company performance, and economic events, so it is important to stay updated with reliable financial information and do your own research before making any investment decisions.
Frequently Asked Questions
Q1. What is ICICI Bank Share?
Ans: ICICI Bank Share represents ownership in ICICI Bank Ltd., one of India’s largest private sector banks. It is listed on the NSE and BSE and is also a part of the Nifty 50 and Sensex.
Q2. Why is ICICI Bank Share popular among investors?
Ans: ICICI Bank Share is popular because of its strong financial performance, consistent growth, digital banking services, and high trading volume. It is widely followed by both traders and long-term investors.
Q3. What factors affect the ICICI Bank Share Price?
Ans: The ICICI Bank Share Price is affected by RBI policies, interest rates, quarterly results, inflation, GDP growth, FII/DII activity, and overall market conditions.
Q4. How can I analyze ICICI Bank Share before investing?
Ans: You can analyze ICICI Bank Share by checking its financial performance, valuation ratios, technical indicators, earnings growth, and recent market trends before making a decision.
Q5. Is ICICI Bank Share good for long-term investment?
Ans: ICICI Bank Share is considered a strong long-term stock due to its solid fundamentals, consistent growth, and leading position in the banking sector. However, every investment involves risk, so research is important before investing.