NIFTY 50 is India’s most popular stock market benchmark and considers the performance of 50 companies listed on the National Stock Exchange (NSE). This index is widely considered a reflection of the Indian economy and is often used to gauge market health, investor sentiment, and sector performance.
What Is NIFTY 50 and Why It Matters
The NIFTY 50 is not just a number. It is an indicator of financial dynamism that illustrates the Indian equity ecosystem. Whether you are a market veteran or investing for the first time, everybody looks at it to get a sense of market direction.
Definition and Composition
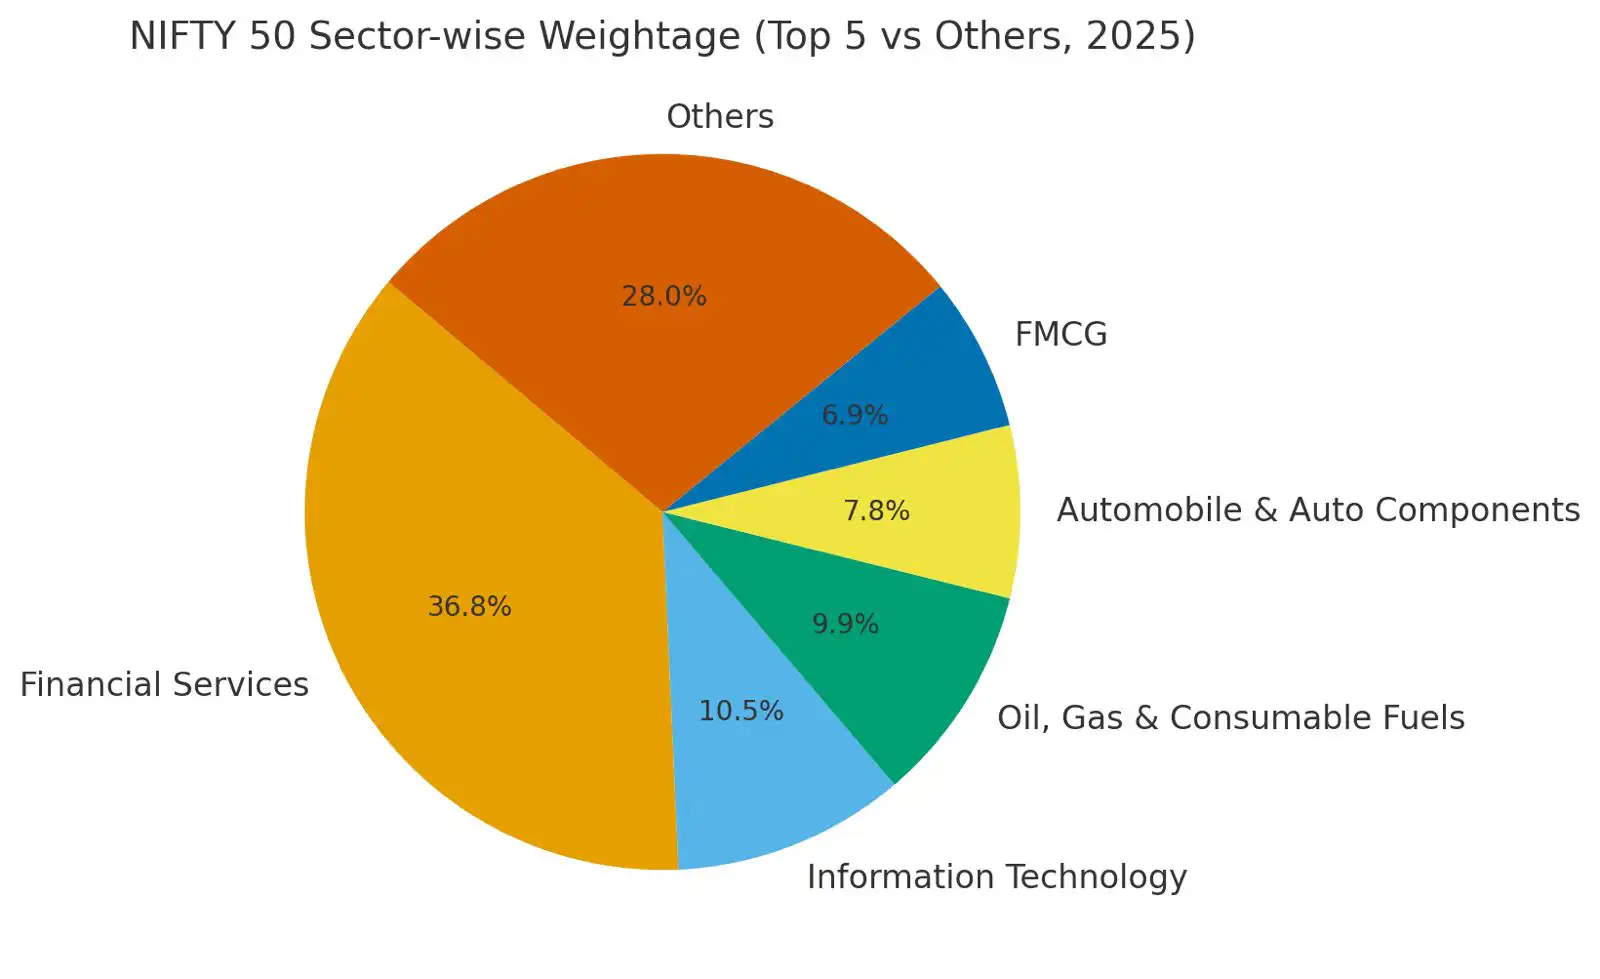
The NIFTY 50 index includes 50 large-cap companies from many sectors, including banking, IT, pharma, FMCG and energy. The weighted average is calculated using free-float market capitalisation to make sure companies with more available shares have more influence.
The importance of NIFTY 50 is enhanced by the periodic review process in place. The index is re-shaped to include only companies meeting entry criteria, including liquidity, market depth, and solid fundamentals.
Benchmark Role in Market Performance
NIFTY 50 is a market benchmark that portfolio managers use as a means of gauging the efficacy of investment strategies. A rising NIFTY typically indicates investor confidence, whereas a decline indicates economic or geopolitical issues.
NIFTY 50 also serves as an underlying to several derivative instruments such as NIFTY futures or options – instruments that traders utilise to hedge against risk or to enhance returns.
Relationship with Sensex and Other Indices
NIFTY 50 provides a broader representation of equities than the BSE Sensex, which includes 30 stocks listed on the Bombay Stock Exchange. They both comprise many sectors and sub-sectors and move in tandem most times; however, differences in calculation and the stocks that make up the respective indices provide different technical perspectives.
Throughout the country, other indices such as the midcap index, smallcap index, and several sector indices (IT, pharma, auto, etc) allow for additional measures of the equities market and provide a little more dimension to the representation of India’s equities market.
NIFTY 50 Recent Trends and Catalysts
NIFTY 50 has been hovering around 25,000 in recent sessions, and we saw major resistance and support levels around 25,000 and 24,700, respectively. Traders and long-term investors are monitoring NIFTY 50 levels around 25,000 and 24,700.
Performance is influenced by Economic Events.
The index recently fell sharply, while the BSE Sensex fell by over 300 points, indicating a degree of caution heading into Q1 earnings reports. In addition, NIFTY 50 is tracking a few pivotal events such as the India-UK Free Trade Agreement that could prove beneficial for sectors heavy on exports, such as textiles and pharma.
Meanwhile, some aspects of the domestic economy factor into investor behaviour and index movement as well, such as inflation rates, GDP and announcements which impact government policy.
Effects of Corporate Earnings and Budget Policies
Quarterly results were a mixed bag. Some companies beat estimates, while others showed weakness. This divergence has created sector rotations, with money moving into defensives (healthcare / FMCG).
At the macroeconomic level, policy changes made in Budget 2025, including capital gains changes and renewals in public sector spending, have influenced valuations for sectors and fundamentally changed investor perspectives. Analysts believe these two factors will be key indicators for the NIFTY 50 trend over the next four quarters.
Role of FII and DII
Foreign Institutional Investors (FIIs) have pulled out a massive amount of capital recently, including ₹11,000 crore+, driven largely by uncertainty in the global economy and a strong U.S. dollar. Domestic Institutional Investors (DIIs), however, have continued to net buy, and have the domestic confidence in the growth story of India.
The rhythm created by FIIs relative to DIIs introduces volatility; however, it also provides opportunities for savvy, disciplined traders who track cash flows.
NIFTY 50 Movements for Technical Analysis
The technical traders utilise different tools for analysing NIFTY 50 and deriving inherent trend momentum.
Critical Support and Resistance
As noted, resistance is found at approximately 24,991 and 25,180. The best support levels are found at approximately 24008 and 24,659 for historical buying interest to return and rebalance. These levels are usually corroborated by tools such as Fibonacci retracement, giving an excellent frame for setting stop losses and take profit levels.
Role of EMAs and Intraday
The 20 and 50-day Exponential Moving Averages (EMAs) are very useful in carrying factual short and medium-term trends. If the 20 EMA is crossed above, there is short bullish momentum; vice versa if it is crossed below. Intraday traders layer hourly charts with daily EMAs to achieve a more precise entry and exit. It is often these visual cues that are discussed by trading desks across all major brokerage houses.
Momentum indicators
The Relative Strength Index (RSI) is a quick way to determine if an index is overbought (above 70) or oversold (below 30), while Bollinger Bands considers volatility and potential reversal points. Using these two indicators together enhances predictability. RSI can indicate when momentum might change, and Bollinger Bands help recognise the perfect zone for a breakout or reversal.
Breakout patterns and predictive modelling
Powerful bullish potential exists if the index confirms a breakout beyond 25,180, while there is selling pressure should the price break down below 24,800. Analysts recommend combining volume readings with price action for greater investor certainty and reliability. Predictive modelling is also an effective way to establish opportunities for highly probable trade setups using historical data patterns and machine learning as a strategy.
Relationship Between NIFTY 50, Bank Nifty and Market Direction
To observe a broader market direction, one must observe Bank Nifty, or the index which includes the largest banking stocks in India. Bank Nifty often leads NIFTY 50 due to the weightage that the banking system has in the NIFTY 50 index.
Predictive Correlation to Bank Nifty
A strong Bank Nifty suggests a strong economy, which will inherently tilt sentiment bullishly on KLC. Recently, Bank Nifty hit resistance near the 57,300 point value, with support about 1,200 points lower (56,100). If resistance is not broken, we can reasonably expect multi-week weakness to persist in larger indices like NIFTY 50.
Patterns like the Gravestone Doji show indecision by investors to commit funds or pull funds, and when identified near the support or resistance level of financial instruments, strongly indicate that the momentum, which on the surface looks the same (indecision), will revert into another momentum in the opposite price direction.
Getting Influence from Major Stocks and Sectors
Major stocks have the heft to drive the index higher, for instance, stocks like ICICI Bank, HDFC Bank, influenced by Strength in Cipla (CASH) and Jindal Steel (CASH) have likely provided some cushion to the overall sell-off. Recent weakness in Oil & Gas, IT show why we had sharp declines.
The rotation of money between sectors for investors and traders is usually enough for changes in the sentiment.
Trade Agreements and Global Cues
The current discussions on India-US trade and India-UK trade have injected some uncertainty into the process. Delays to trade agreements inherently create uncertainty, and there can be policy shocks as well. Policy shocks as a result of fiscal policies in other parts of the world, like tariffs, could cause more volatility for the index. The Federal Reserve’s rate stance and China, as an indirectly relevant global player, ongoing economic recovery will affect these agreements.
In the absence of global clarity, expect a range-bound NIFTY 50 – that reacts sharply to earnings surprises and economic news.
Final Thoughts: Keep pace with NIFTY 50 and Bank Nifty in the Market
Today’s market requires far more than just knowing where indices are; it requires knowledge, speed, and powerful trading tools. Whether you are looking for the next move in NIFTY 50 or the next opportunity in Bank Nifty, being informed and quick is key.
Trade Smartly with Tradex.live
If you are looking to capitalise on Bank Nifty and NIFTY 50 moves quickly and easily without the complications of high fees or lengthy integrations, Tradex.live is the right choice.
With features such as:
- Zero Brokerage
- 500X Leverage
- Withdraw any time, every time
- No KYC
Tradex.live provides the speed, transparency, and advantage that traders today expect. It is usable by both new and experienced traders, and is suitable for traders to trade smartly and simply.
Make each change in your trading platform count! Because in a fast-moving market, your trading platform should be even faster.
Download app: Android User | IOS User | Web Trader
Reach Tradex.live: https://tradex.live/links/