There is a trading principle: Trade what you see, not what you Think.
It means to focus on the chart, not your guesses. See first and act later!
The market rewards patience, not panic. That’s why TradingView makes things simple and clear. Not only this, it can also help you to understand the market better.
This question might bother you: Where is the best TradingView tutorial India available?
Right? But don’t push the panic button.
Confused by charts? Tradex1.live brings a powerful yet easy-to-follow guide that is just what you need!
With the right platform and knowing about how to use TradingView for stock analysis, you can turn confusion into clarity.
So why wait?
Start simple. Grow smart.
Begin with the foundation: What is actually TradingView?
It is a significant online platform that can allow traders to analyze stocks utilizing the charts. Not only this, but it can help to understand the price movements in the simplest manner. The result? The traders can understand the market well and make intelligent decisions.
This technical analysis platform is the prominent choice of beginners as well as experts.
Why traders love this platform
- Who doesn’t want the powerful charts? They have clean, easy, and most importantly, interactive charts.
- A huge range of 100000+ indicators to know about the trends and signals.
- Get access from everywhere no matter if you have a PC, web, or mobile.
- It has an incredible global community so that you can learn from real traders.
- From minutes to monthly charts, it has multiple time frames available.
Key features of the TradingView tutorial India
TradingView is more than chart tools, but it is a complete trading platform so that you can trade smarter, not harder.
Here are its key features.
Learn together, grow together.
It has a worldwide community of 50+ million traders for exchanging ideas as well as strategies.
Choose your view; look at the trend.
From simple types of line charts to bar charts to advanced Renko charts, you get it all in one place.
Multi-chart layouts at a glance
You can have up to 16 charts on one screen to analyze multiple time frames.
Practice before you place.
You can use a bar-by-bar reply so that you can validate trading ideas utilizing historical data.
Build your edge; get custom indicators set up.
Create your custom strategies as well as indicators that can perfectly align with your style.
Want to spot trends before the crowd? Connect Tradex today and grab your profit opportunities.
TradingView tutorial India: Strength Vs. Limitations
Before relying on any TradingView setup India, it is highly important to look at both sides.
TradingView is powerful, but there is no 100% accurate setup. Below is the table that gives you the complete clarity.
| Strength | Limitations |
| High quality of NSE as well as BSE data with proper adjustments | To place trades, there is no direct broker integration |
| Even when the market is volatile, get fast and quick charts. | Manual execution, which can boost delays |
| A strong community to get real traders’ support. | Option data does not always give certain and accurate results. |
| Custom time frames, even non-standard ones such as a 17-minute chart | For Indian stocks the historical data is quite old and limited. |
| Work across various devices with no restriction. | Customer support is not fast, and the wait time is about two weeks. |
| Get alerts and flexibility with mobile app | Backtesting sometimes does not match with the real execution. |
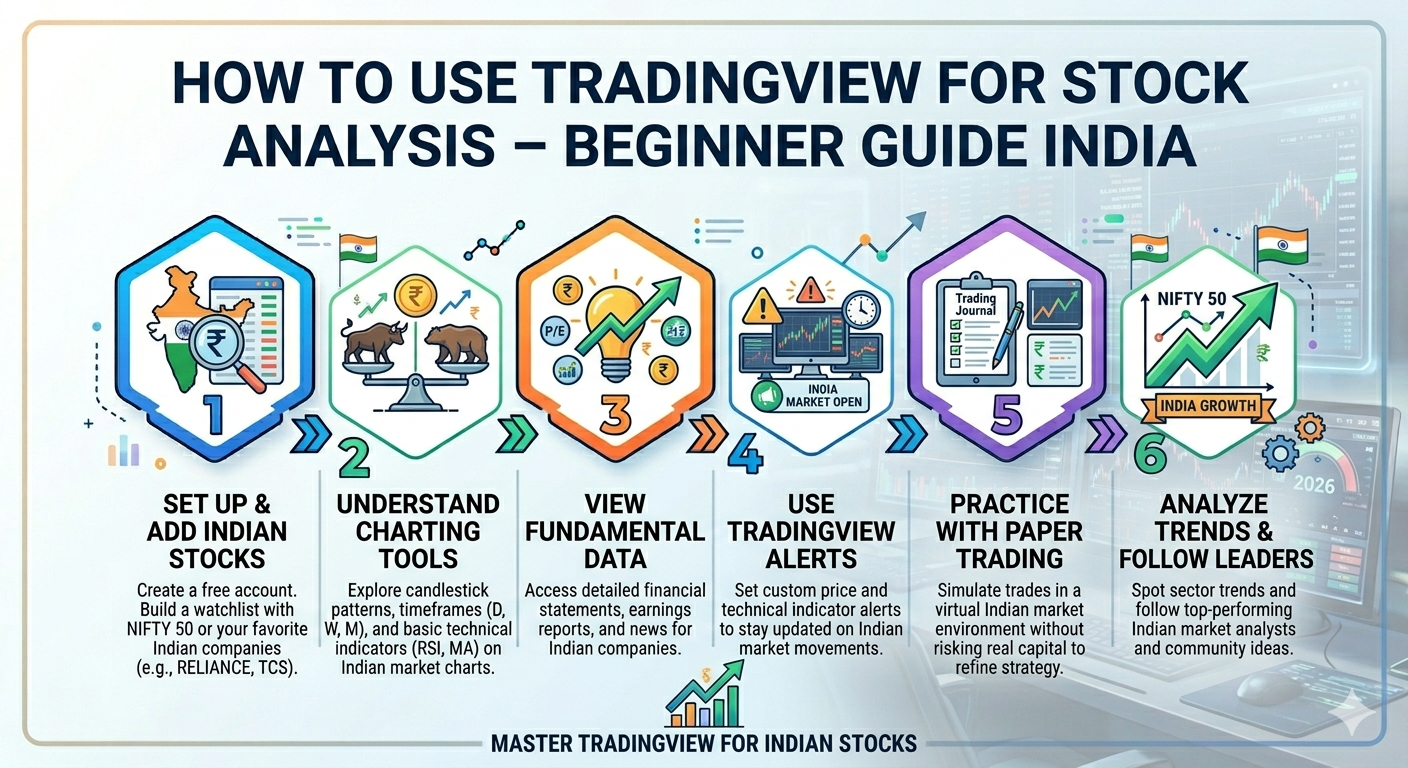
Step-by-step process for TradingView setup India
You can access TradingView chart tools in a simple manner such as
Step 1: Open an application/website
Start with your account ready by downloading the TradingView app from the Google Store, Apple Store, or even from the browser.
Step 2: Pick your instrument.
After TradingView set up India, you can go further by choosing the instrument that you want to analyze, such as a stock index, commodity, crypto, etc.
Step 3: See the market visually on a chart.
Tap the section where you can find the chart button or icon, and the interface will give you the complete charts with candlesticks, lines, or bars.
Step 4: Make it your own! Customize it!
Once you have the understanding of how to use TradingView charts, the next is to customize them by using chart type, adding indicators, and drawing trend lines and patterns.
Step 5: Never miss a trade setup with alerts.
Tap the button of alert so that you can track the conditions such as price level, strength, change, indications, etc.
Pro tip: While using TradingView, always use a great trading app like Tradex1.live. So don’t watch the market; just start trading with Tradex1.live. Click here!
TradingView tutorial India: Basic terms that you should know
Below are the basic terms that allow how to use TradingView charts
- RSI
It is referred to as the relative strength index, which reflects if the stock is oversold or overbought. If the RSI value significantly goes below 30, then it reflects oversold conditions, while above 70 indicates overbought conditions.
- Volume
It indicates how many shares or contracts are being traded. If there is any boost in volume, then it reflects the price trend.
- MACD (moving average convergence divergence)
It reflects the alterations in momentum by tracking the relationship that happens usually between two moving averages.
- Support/resistance levels
It can effectively spot the price points where the stock may get reversed and stop. It can also be made manually by utilizing horizontal lines.
Final thoughts: Execute with Ease with Tradex1.live
Let your trend guide you, not your emotions.
Catch the trends early with TradingView, and it’s your window into the market.
This TradingView tutorial India can help understand spot trends and price movements and plan trades in a smart manner.
Start small. Observe patterns.
Don’t just watch charts; act on them. Trade smarter with Tradex1.live. Join Now!