Swing trading sits between day trading and long-term investing. You hold positions for days or weeks. You catch medium-term moves. You don’t stare at screens all day. This approach suits people with jobs, families, or simply a preference for less stress. But to succeed, you need a clear method. That method starts with technical analysis for swing trading.
In this guide, I’ll show you the essential tools and a simple process to identify high-probability swing trades.
Why Swing Trading Works for Beginners
Swing trading gives you time to think. You don’t need to react in seconds. You analyze charts in the evening, place your orders, and let the market work. This slower pace makes technical analysis for swing trading more forgiving than intraday strategies. You learn to read price action without the pressure of a ticking clock.
The Right Timeframe: Your First Decision
Swing traders live on the daily and 4‑hour charts. These timeframes filter out the noise of the 1‑minute or 5‑minute bars. They show you the true trend.
I start with the daily chart to define the overall direction. Then I drop to the 4‑hour chart to find entry timing. This two‑step approach is the backbone of technical analysis for swing trading.
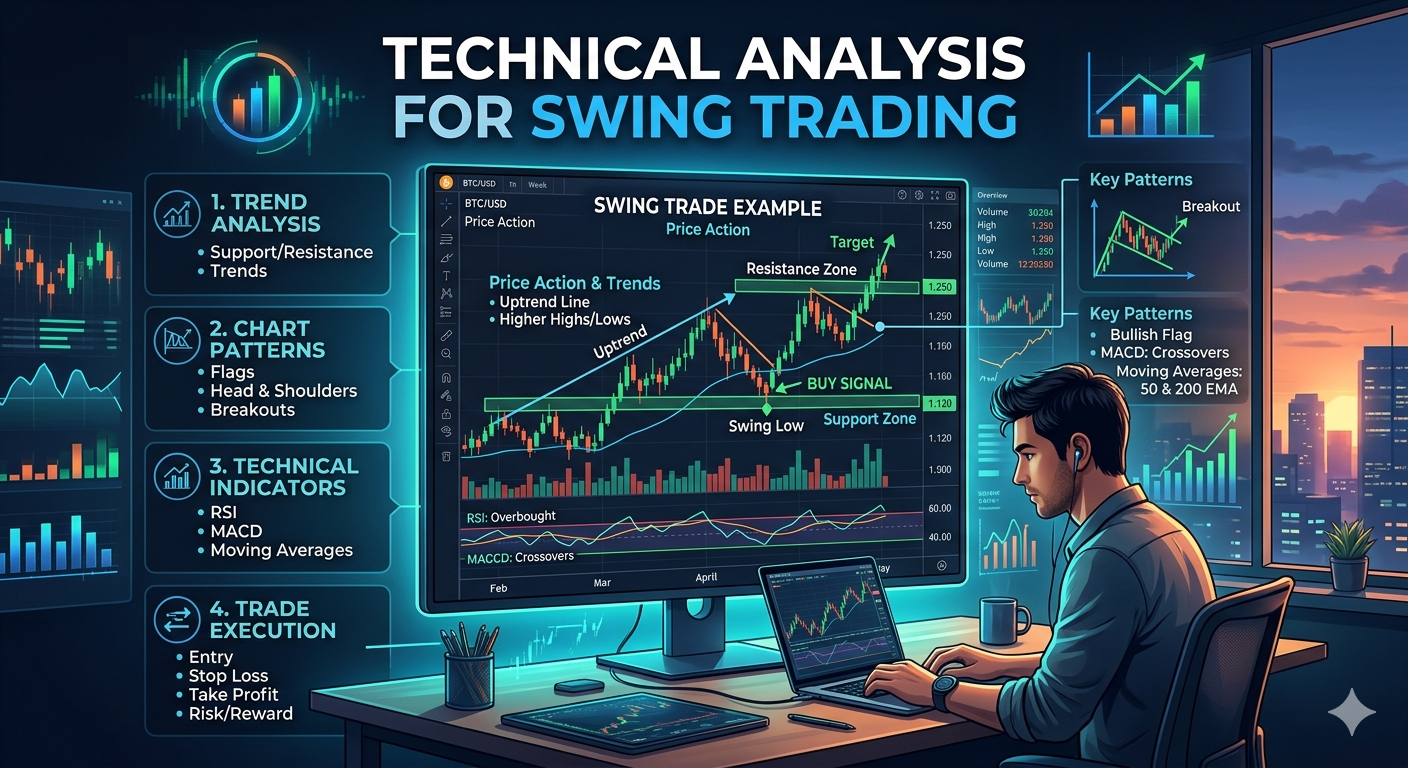
Trend Identification: The Foundation
You never want to fight the trend. In a strong uptrend, look for buying opportunities. In a strong downtrend, look for selling opportunities.
How to spot the trend:
– Use a 50‑period Simple Moving Average (SMA) or Exponential Moving Average (EMA) on the daily chart.
– When price stays above the 50 EMA, the trend is up.
– When price stays below the 50 EMA, the trend is down.
I also draw trendlines. An uptrend connects higher lows. A downtrend connects lower highs. Breaking a trendline often signals a potential reversal.
Key Levels: Support and Resistance
Price moves between levels where buyers or sellers step in. These are support (where price bounces up) and resistance (where price turns down).
Where to find them:
– Previous swing highs and lows
– Round numbers like 1.2000 or 150.00
– Moving averages (20, 50, 200 EMA)
– Fibonacci retracement levels (38.2%, 50%, 61.8%)
For a swing trade, you want to enter near a key level. Buying at resistance is a losing game. Buying at support in an uptrend gives you a defined risk and a clear target.
Candlestick Patterns: Your Entry Trigger
Once you have a trend and a key level, you wait for a signal. Candlestick patterns show you when buyers or sellers take control.
Bullish patterns for a long entry:
– Bullish engulfing: a green candle completely covers the previous red candle.
– Hammer: a small body with a long lower wick, appearing at support.
– Piercing pattern: a green candle closes above the midpoint of the prior red candle.
Bearish patterns for a short entry:
– Bearish engulfing: a red candle covers the previous green candle.
– Shooting star: a small body with a long upper wick at resistance.
– Dark cloud cover: a red candle closes below the midpoint of the prior green candle.
I don’t enter without one of these patterns. They give me confidence that momentum is shifting my way.
Momentum Indicators: RSI and MACD
Oscillators help you gauge whether a move is losing steam.
Relative Strength Index (RSI):
– In an uptrend, RSI usually stays above 40. Pullbacks push RSI toward 40‑50, not necessarily to 30.
– Divergence is powerful. When price makes a lower low but RSI makes a higher low, selling pressure is fading.
MACD (Moving Average Convergence Divergence):
– The MACD line crossing above the signal line gives bullish momentum.
– The histogram bars show strength. Increasing bars confirm the move.
These tools add another layer of confirmation to your technical analysis for swing trading.
Volume: The Silent Confirmation
Price moving without volume lacks conviction. You want to see volume spikes on breakout days. For pullbacks, volume should contract as price retraces, then expand again when the trend resumes.
A Simple Swing Trading Process
Here’s a step‑by‑step routine I use.
Step 1: Identify the trend on the daily chart.
– Price above 50 EMA and making higher lows? Focus on longs.
– Price below 50 EMA and making lower highs? Focus on shorts.
Step 2: Find a key level on the daily chart.
– For a long: look for price pulling back to the 20 or 50 EMA, a Fibonacci level, or a previous support zone.
– For a short: look for price rallying to resistance.
Step 3: Switch to the 4‑hour chart.
– Wait for a candlestick pattern to form at the key level.
– Check RSI and MACD for confirmation.
Step 4: Plan your trade.
– Entry: at the close of the signal candle or on a small retest.
– Stop loss: below the recent swing low for longs, above the recent swing high for shorts.
– Target: the next obvious support or resistance level, often 2‑3 times your risk.
Step 5: Manage the trade.
– Move your stop to breakeven once price moves in your favor.
– Trail your stop using the 20 EMA or recent swing points.
Common Mistakes Beginners Make
Trading against the trend. Buying a pullback in a downtrend is like catching a falling knife. Always align with the daily trend.
Entering without a signal. A key level alone isn’t enough. Wait for price to show you it respects that level.
Risking too much. Swing trades need wider stops. If your stop is 100 pips away, size down. Never risk more than 1‑2% of your account on one trade.
Moving stops randomly. Set your stop based on structure, not on emotion. Moving it closer because you’re nervous is a quick way to get stopped out.
Tools to Execute Your Swing Trading
You need a platform that lets you draw trendlines, apply moving averages, and mark key levels easily. Tradex1.live offers clean charting with all the indicators I’ve mentioned. You can save your chart setups and revisit them daily. The platform runs smoothly, even when you have multiple charts open.
Tradex1.live also provides a demo account. That’s where you practice technical analysis for swing trading before committing real money. Test your process, refine your rules, and build confidence.
Building Your Swing Trading Routine
Set aside 30‑60 minutes each evening. Scan the daily charts. Identify trends and key levels. Mark potential setups. Wait for signals the next day.
This routine turns trading from a chaotic activity into a disciplined process. And discipline, more than any indicator, determines long‑term success.
Final Thoughts
Swing trading is one of the most accessible ways to start trading. It doesn’t require constant screen time. It rewards patience and planning. By mastering technical analysis for swing trading, you give yourself a structured path to consistency.
Start with the daily chart. Find the trend. Wait for a pullback to a key level. Enter on a candlestick signal. Manage your risk. Repeat.
The market will always be there. Focus on getting the process right, and the results will follow.
Risk Disclaimer: Trading financial instruments on margin carries a high level of risk. It may not be suitable for all investors. The possibility exists that you could sustain a loss of some or all of your deposited funds. You should ensure you understand all the risks involved. Seek independent advice if necessary.